Quality Parameters and Quality Control Methodologies

For any food product, quality is subjected to consumer perceptions of taste, mouthfeel and colour. This is also true for coconut liquid products. As coconut water, milk and cream are increasingly consumed worldwide, the quality of coconut liquid products can be better determined by objective assessments.
Several quality parameters, which differ in chemical composition, can define the makeup of each product. These parameters refer to the chemical, microbiological, nutritional and physical factors that make up the coconut liquid products its unique properties, which also influences the products shelf life. For example, as coconut water and milk are low-acid and high water activity foods, they become highly susceptible to microbial spoilage and deterioration.
That said, research studies are still not extensive enough to cover all aspects of coconut liquid products. Therefore, this chapter serves as a guide by attempting to consolidate and recommend possible quality control methods to objectively define coconut liquid products and suggest a range of values for each parameter. It is important that experienced quality control personnel and statisticians are employed to conduct quality checks and shelf life studies for these products.
The recommended quality control parameters are shown in Table 14.1. All tests should be done before and after aseptic processing and packaging. However, for boxes which are not ticked, it is optional or of less importance to do so for the respective products. Analytical methods for the respective quality parameters are also recommended in CODEX STAN 247-2005, unless otherwise stated.
Besides flavour, all listed parameters can be determined by standard methods of analysis to give meaningful and reliable results. This is because flavour and odour are commonly evaluated by sensory means, usually by groups of panellists. These analysis methods were collected and published in books such as Guidelines for Sensory Analysis in Food Product Development and Quality Control (Carpenter et al., 2008) and Sensory Evaluation by Quantitative Descriptive Analysis (Stone et al., 1974).
Quality control methodologies and suggested quality parameters
Total soluble solids
Total soluble solids is an important quality parameter in many food products. Its analysis is also a commonly practiced one. It typically indicates the amount of dissolved sugars in the product, thus affecting both safety and hedonic properties. It can be measured using a refractometer, which calculates the total soluble solids of the sample in °Brix, and is more important for coconut water.
Dry matter or total solids analysis
The analysis for dry matter or total solids can be done by oven or infrared drying. In oven drying, direct heating is used to dry the sample, followed by manual weighing. These analyses are more so important for coconut milk and cream, which standards have been defined by CODEX STAN 240-2003.
pH measurement
pH is a crucial parameter for food as it indicates the sourness of a product and its current shelf life stability. For coconut water and milk, the pH measurement drops over the course of its shelf life, until it is exceeded. Using a calibrated pH meter, the pH of a sample may be measured.
Titratable acidity (TA)
In coconut water, TA is expressed as the percentage of malic acid equivalent. More specifically, TA is determined as the malic acid equivalent by titration of a sample against 0.1N NaOH. The sample is titrated until pH 8.2. The sample can be diluted where required.
Microbiological testing
Microbiological testing can be measured as the Total Aerobic Count (APC), as well as Yeast and Mould Plate Count (YMPC). First, samples are collected and used to prepare serial dilutions of the samples. Then, diluted samples buffered at pH 7.2 are placed onto agar plates or petri films with different kinds of nutrient media available to culture microorganisms for APC and YMPC.
Thereafter, the diluted samples are incubated at 37°C for
24-48 hours for APC. For YMPC, they are incubated at 25°C for
3-5 days, or as stipulated by regulations (US FDA, 2001). Taking into account the dilution factor, the colony forming units are calculated in the original sample and checked against the local authority’s compliance standards for quality control.
Sulphite test
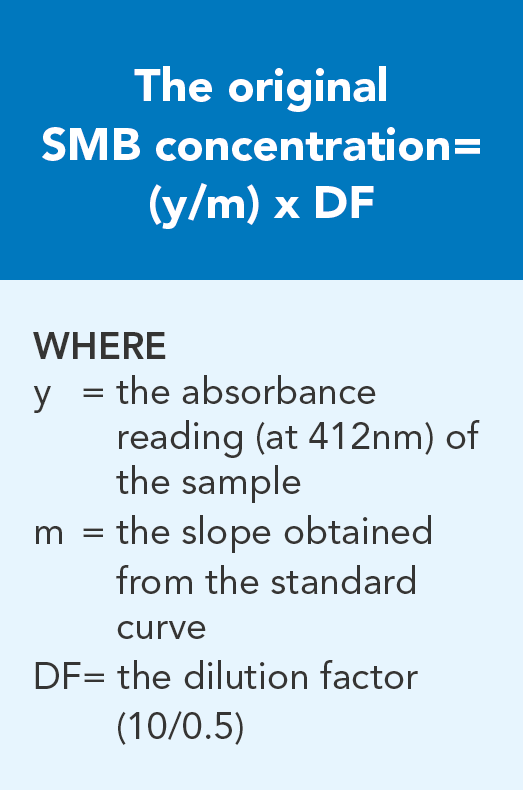
Sulphite test can be used to determine the amount of sulphite residue in coconut water, milk and beverages. There are many ways to do so. In this chapter, we will cover two methods, using sulphite test strips and DTNB test. For a faster and approximated result, sulphite test strips may be used. For a more accurate result, the DTNB test may be used.
The residual levels of sulphite in the coconut liquid products are regulated by laws and changes between countries. It is recommended to consult with the regulatory experts in the respective countries.
Colour
Browning in coconut water
Browning is an especially prevalent problem in coconut water. It is a visual component of the product that is often used as an indicator of shelf life acceptability, even though browning by itself may not be indicative of product spoilage. The browning index reflects the cumulative browning of all pathways, including enzymatic and non- enzymatic occurrences in coconut water. Examples are Maillard reaction and ascorbic acid browning. The standard for acceptable browning is set by the individual company or customers.
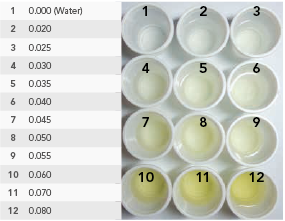
The browning index (BI) is calculated as the difference between the absorbance at 420 nm and 550 nm (to correct for turbidity). The absorbance of the samples is first recorded at 420nm (A420) and 550nm (A550), then the Browning index is calculated.
Using samples with different degrees of browning, construct a browning scale index and establish a standard. For example, Index 9 of BI 0.055 (Figure 14.1).
Pinking in coconut water
Pinking is caused by an intermediate in the polyphenol oxidase- catalysed browning reaction and is typically found in young coconut water only. It is an indication of cracks in young coconut, which lead to the exposure of coconut water to the external environment.
Discolouration in coconut milk
Coconut milk normally appears as creamy white. Due to reactions such as browning, it may be discoloured, forming a brown, greyish or off-white colour. The colour of coconut milk is also affected by oil globules. In general, when there are small and numerous droplets, the reflectance off the oil globules gives a white colour.
The colour of coconut milk can be analysed by measuring the reflectance with a colorimeter to obtain three Hunter parameters, namely “L” lightness, “a” red or green component and “b” yellow or blue component. L and b can be used to describe the change in colour of coconut milk (Chiewchan, 2005). A two-axis scale can also be set up for the colour of coconut milk using “L” and “b” values. Although tedious, this scale is valuable to have.
Optical density or turbidity test
Optical density can be used as a measure to indicate the colour of the product sample. A cut-off point above or below a sample is deemed to have passed its shelf life. It should be determined by the specific product requirements. Using an appropriately calibrated spectrophotometer, absorbance of samples are recorded at 600 nm. Using a series of samples from various times in its shelf life, set a standard for quality control of the sample.
Turbidity is an important quality parameter for coconut water, as customer’s acceptability may decrease as turbidity increases. Turbidity can be measured using a turbidimeter to establish a standard. This is a faster method to measure the clarity levels of coconut liquid products. This test is more important for coconut water as coconut milk is naturally opaque.
Free fatty acids (FFA) measurement
FFA is commonly a product of fat hydrolysis. It is therefore an indicator of spoilage in foods. The presence of FFA is usually associated with the onset of rancidity and off-flavour development, which is especially important in foods with significant fat content, such as coconut milk and cream.
Titration method is used to measure FFA content in a food sample. First, titration of the product is carried out against a standard NaOH solution, with phenolphtalein as an indicator. For coconut products, FFA is usually a reflection of its free lauric acid content which has a major presence.
* Please note that the sample may be diluted as necessary
Viscosity measurement
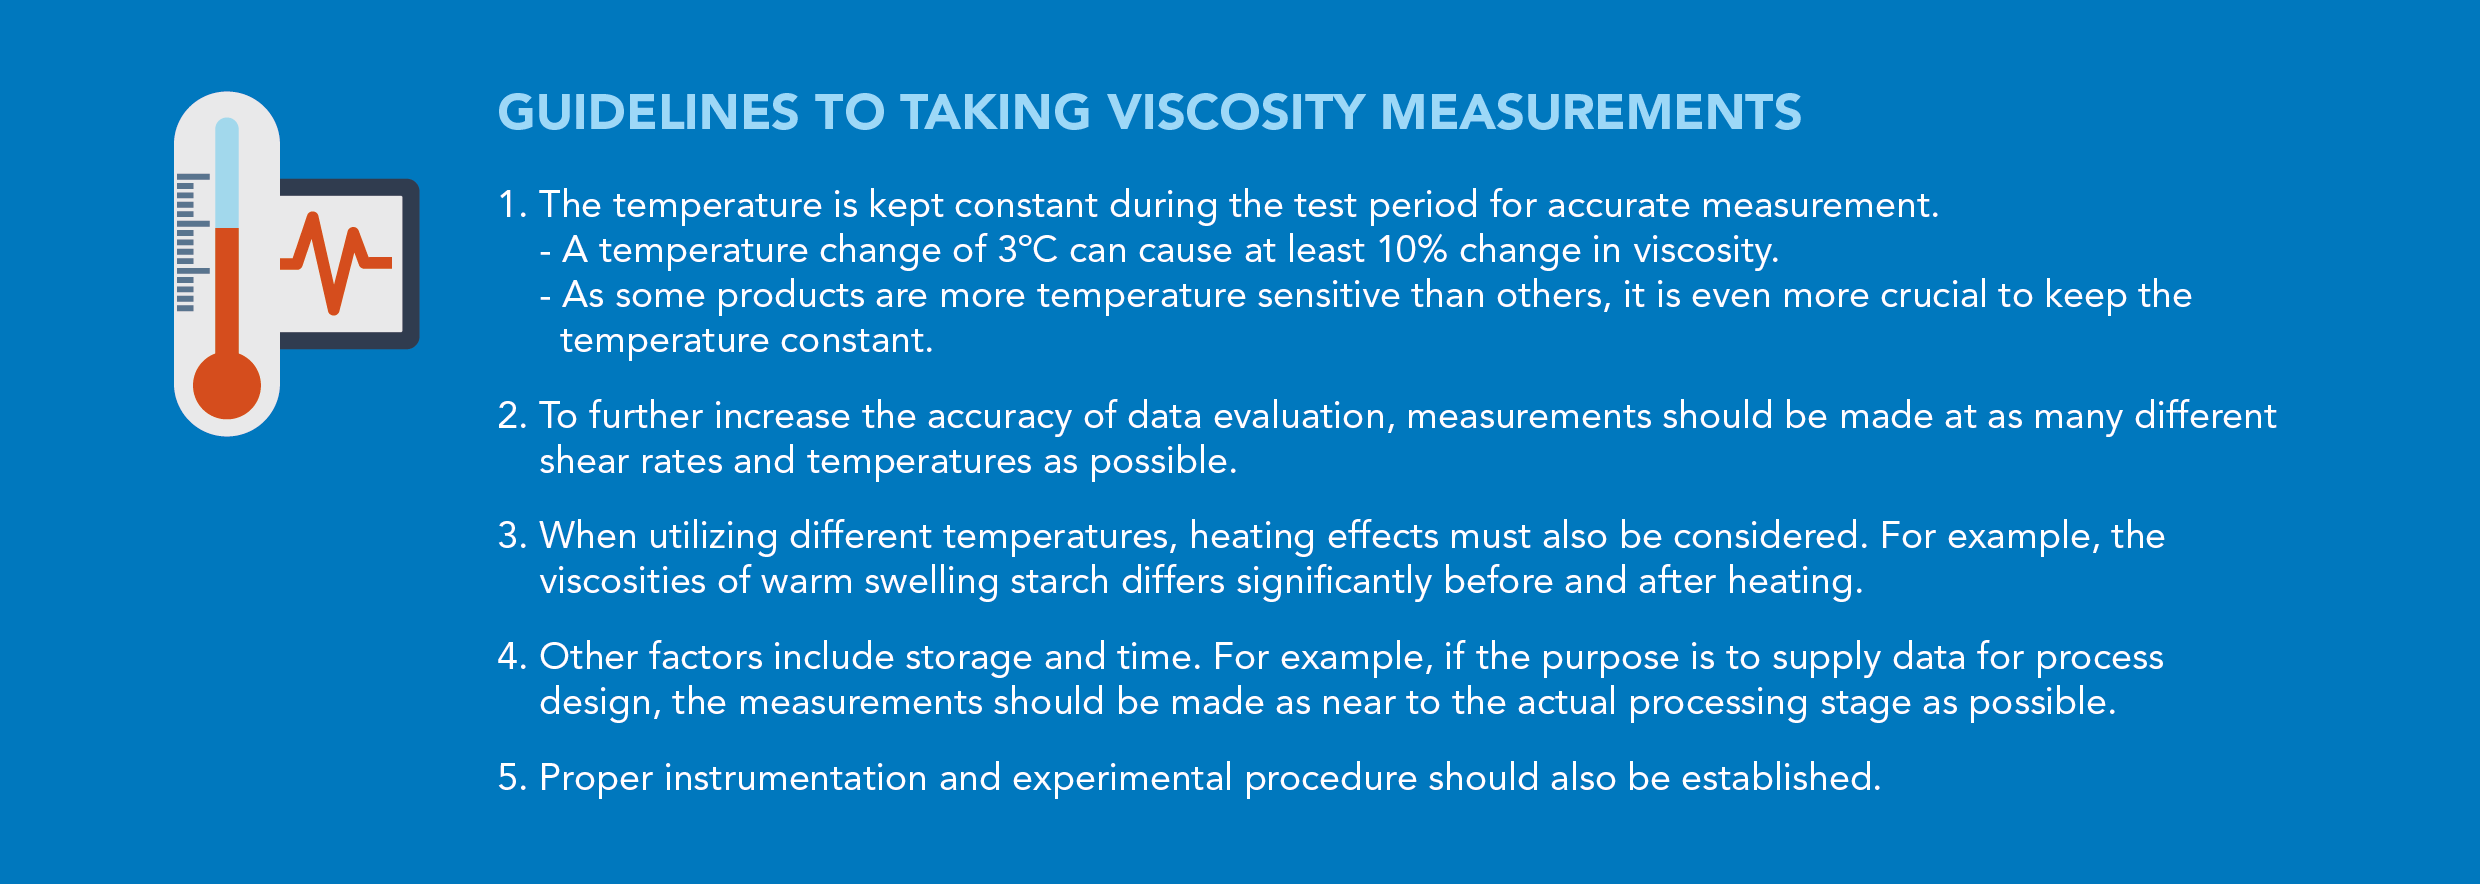
Viscosity measurement is used to determine the thickness of the product, thus relating to the filling component in the production run, as well as the product’s mouthfeel and stability. Using a temperature controlled Brookfield viscometer, the viscosity of a product can be measured at different shear rates. These measurements characterize the rheological behaviour of the tested sample and are important in the designing and fine tuning of aseptic line solutions in terms of packaging and processing equipment. This measurement is more applicable for coconut milk and cream, where the product can be very thick, depending on the formulation and process parameters (e.g. homogenization pressure). It is generally observed that coconut milk and cream increase its viscosity with storage time. Please refer to Chapter 10 for more details.
Note
Viscosity affects the pourability of the product from the package. There are no suggested ranges for the viscosity of coconut cream. Analysis of commercial samples at Tetra Pak in-house rheology lab (RheoLab) shows that, at a shear rate of 100s-1 with temperature of 30°C between 17-25.1% of oil content, the viscosity of coconut milk can range from as low as 8 mPas to as high as 260 mPas.
Accelerated shelf life
Coconut liquid products are packaged to maintain quality during its defined shelf life conditions. Shelf life depends on several factors, such as raw material quality, processing parameters, storage conditions and the threshold of acceptance of the individual consumer. It cannot be determined in terms of time by the packaging material supplier. Although processing and packaging can protect the contents, it cannot improve the quality of the coconut liquid products if they were produced from bad raw materials.
Accelerated shelf life determination (ASLD)
ASLD is used to shorten the time required to estimate a shelf life, which otherwise can take an unrealistically long time to determine. As the food trade globalizes and competition in the food market intensifies at national and international levels, there is a greater need to quickly determine shelf life within a shorter time period. This situation becomes more pressing when shelf life is expected to range from several months to a few years. Therefore, the set up for ASLD usually involves increasing the product’s storage temperature to accelerate time required to reach the end of its shelf life.
The typical storage temperature for ASLD studies are as follows:
As most reaction rates increase exponentially with a rise in temperature, increasing the temperature by 10°C can cause quality loss to increase by a factor of 2-6. This simplified factor, known as Q10, depends on the food being evaluated, the mode of failure, and the temperature range.
To calculate the Q10 factor, the product is stored at three to four different temperatures within the specified range. Each temperature is constantly maintained within 1°C, and the ASLD temperature range is usually raised slightly above the control temperature. This helps to avoid changes in the product failure mode.
Besides elevated temperatures, additional ASLD conditions are also occasionally employed. These include elevated humidity, oxygen tension in the headspace and cycling temperature fluctuations. However, the complexity of these factors requires special mathematical data manipulation, which makes their application quite cumbersome.
Accelerated shelf life testing requires careful methodology. As such, a number of test conditions must first be made before the study.
Recommended experimental set-up for coconut liquid products
After a specified treatment and storage duration, the recommended experimental set-up for the estimation of shelf life is as follows:
In general, it is expected that products stored at higher temperatures will have a shorter shelf life. Thus, shelf life study for samples stored at higher temperatures may end sooner. In comparison, samples stored at 4°C can be expected to last at least three months without any significant change in quality. Tables 14.11 and 14.12 may be adjusted to fit the conditions where necessary.
The browning index of coconut water as a limiting factor to determine the shelf life of long life coconut water is illustrated below. First, packed coconut water samples at four different temperatures are stored for up to seven months (28 weeks). At each storage interval, samples are removed and analysed for the browning index. When stored, there will be a gradual increase in the browning index of the coconut water throughout the storage period.
Shelf life is calculated based on the following equation:

